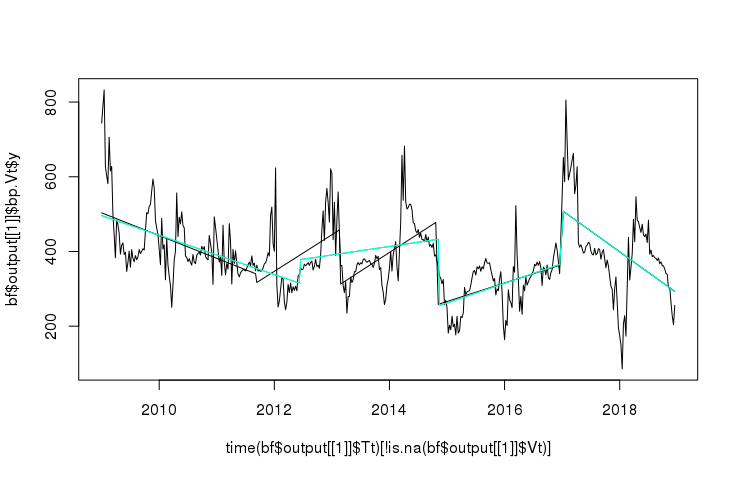
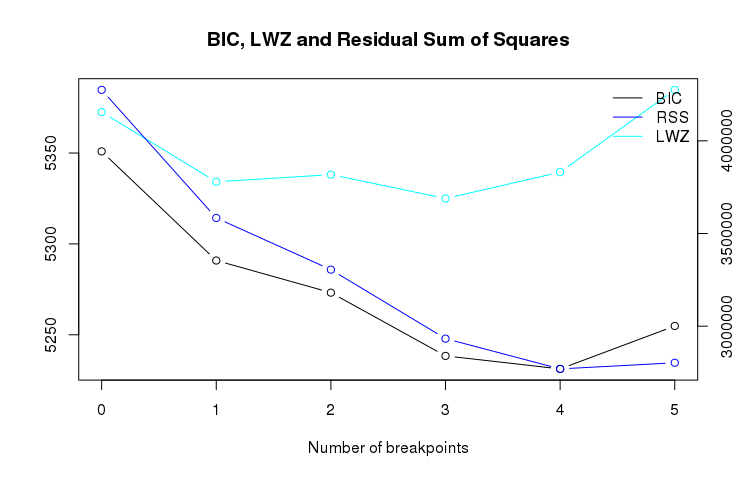
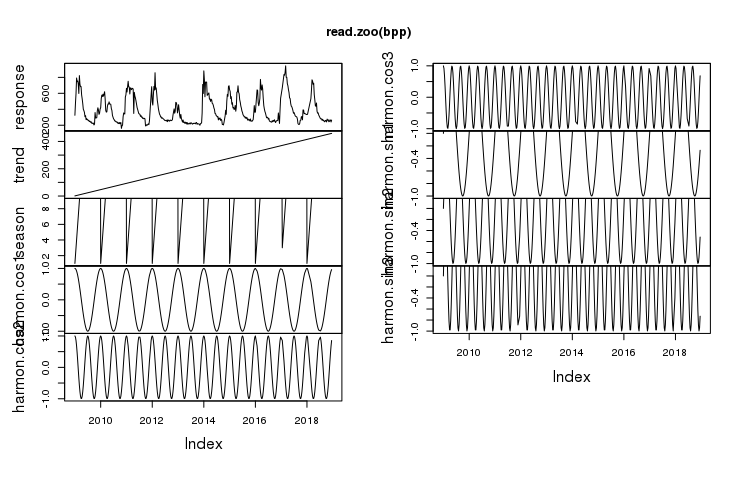
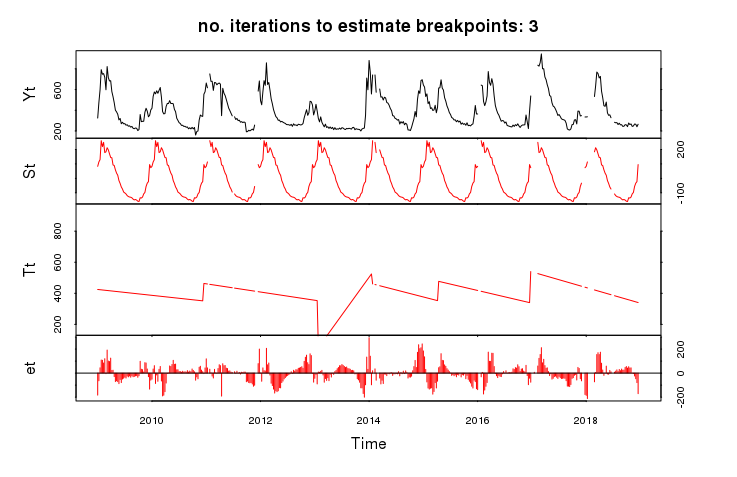
class: center, middle # BFAST family of break detection algorithms --- # Algorithms * BFAST Monitor (`bfastmonitor()`)/`bfastSpatial` * 1 break at the end of the time series * BFAST0N (`bfast0n()`/`breakpoints()`) * All breaks in the time series, without decomposition * Can handle many `NA`s, order of magnitude slower than Monitor * BFAST (`bfast()`) * All breaks in the time series, with decomposition * Cannot handle (many) NAs, order of magnitude slower than BFAST0N * BFAST01 (`bfast01()`/`bfast01classify()`) * One break in the time series, change classes [https://github.com/bfast2/bfast](https://github.com/bfast2/bfast) --- # BFAST0N * `bfast0n()`, a wrapper around `bfastpp()`+`strucchange::breakpoints()` * `strucchange::breakpoints(formula, data, h)` * `data`: any data.frame/matrix with numbers or `ts` * `formula`: e.g. `response ~ trend + harmon` * `h`: minimum segment size, either fraction of the time series length or integer defining the number of samples * Output: `breakpointsfull` that indicates breakpoint timing and confidence interval, in sample numbers (mapping to `data`) --- # Principle of `breakpoints()` * Piece-wise linear regression: * Given that we want one break, what’s the optimal location to put it so that the RSS of two segments is minimised? * What if we want two breaks? * Etc. etc. to get a triangular matrix of possible breaks and model RSS * But how many breaks does the time series have? * An Information Criterion: if we increase degrees of freedom by adding breaks, data will fit better, so penalise for each degree of freedom added * AIC (k=2) is too weak, BIC (k=log(n)) is also often too weak * LWZ (k=0.299 × log(n)^2.1) seems to do better * BIC used in `breakpoints()` by default for backwards compatibility, `bfast0n()` may use LWZ --- # Breakpoints using LWZ vs BIC Black: BIC, teal: LWZ  --- # Breakpoints using LWZ vs BIC Statistic change when we increase the number of breaks  --- # `bfastpp()` * How do you get data in a format where you can use `formula = response ~ trend + harmon`? * `bfastpp(ts, order)`: preprocessing of time series * `ts` must be a `ts` object with frequency > 1 * `order` is the harmonic order --- # bfastpp output Output is a data.frame with components:  --- # `bfast()` BFAST: decomposition of time series into season, trend and irregular components  --- # BFAST * AKA "Original BFAST" * Uses breakpoints() to detect univariate breaks on each individual component, thus separate season and deseasonalised trend breaks * Iterative approach, process run multiple times (can override) * Gives an indication of magnitude (difference between fitted trend values between segments) and specifically the largest break too * No Spatial equivalent: reported breaks are not constant, so hard to put into raster layers * If h = 1 year, then can output one layer per year, saying whether there was a break detected or not, and when